Candlestick charts make an extremely important part in the arsenal of a technical analyst.Although there are other types of charts also available like line,mountain and OHLC charts but the information Candlestick charts provide about a security earns them a special place in the technical analysis arena.
Candlestick charts originated in Japan,hence popularly called as Japanese Candlestick Charts.
These charts consist of combination of Candles plotted on a graph. A candlestick depicts the behavior of a security in a specific time frame.In a daily Candlestick Chart,a single candle shall show the behavior of the security in a single day of trading.Likewise,we can select candlesticks for hourly,weekly,monthly or yearly time frames.
What is a Candlestick ?
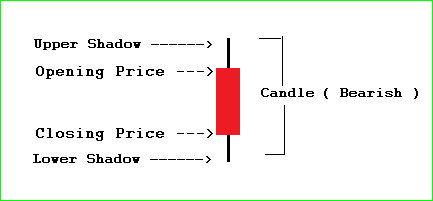
If you see a candlestick chart,you will find that a typical candlestick consists of a middle thick body and two shadows-on the upper and the lower end of the body ( see the figure ).The whole length of the candle shows the entire price range of the security in a particular time frame.Here we talk of a candle formed by single trading session movement of the security/stock.
 |
| Bullish Candlestick |
When the market opens,the stock also opens at a particular price level.This is the first traded price of the stock and it leads to the formation of the lower end of the body of the candlestick ( green portion ).After that ,the stock touches the highest and the lowest price of the day which is represented by the upper and lower shadow respectively,before closing at a higher price which is represented by the upper end of the body of the candle.
 |
| Bearish Candlestick |
When a stock opens at a lower price and closes at a higher price at the end of the day,it makes a green candle on the daily candlestick chart.Some charting software represent the green candle by blue colour.All in all,these candles make bullish candles.It means that stock prices have moved higher at the end of the day.
If a stock opens at higher price level in the morning and after making highs and lows closes at lower price level than the opening price,a red candlestick is formed on the candlestick chart.This is called a bearish candle and it indicates that the price of the stock has moved lower in the trading session.
How candlesticks are important to a trader ?
A candlestick in itself explains the behaviour of the majority of the traders and thus provides cues to a trader in taking trading decisions.
A green candle with a large body and short shadows indicates that buyers are very aggressive in that particular stock.
Similarly,a large body red candle with small or no shadow indicates that sellers are dominating in the particular script.
A candle with small body and large shadows on upper and lower end depicts indecision in the minds of traders
long shadow on the upper end shows that stock moved higher but could not sustain there and closed at lower price.Thus it indicates resistance at higher levels.
Similarly,long shadow at lower end depicts that after touching lows for the day,stock moved up and closed above the lows.S it indicates that buying support is there at lower levels.Hence stock can be considered for buying for short-term trading.
These different formations of the candlesticks lead to formation of short-term patterns like Doji,Shooting star,Hammer,Bar reversal patterns and many more which we shall discuss in our next articles.


No comments:
Post a Comment